


서론
개발을 하다보면 다이어그램을 그릴 일이 자주 발생한다. 대표적으로 Draw.io 또는 파워포인트를 통해 다이어그램을 작성하는 편인데, 최근 D2 - Diagram Scripting Language 오픈소스로 전환 | GeekNews (hada.io) 글을 통해 Diagram Scripting laguage 를 접하게 되었다.
소개
D2 - Diagram scripting language 는 다이어그램을 정해진 형식에 맞게 작성하여 다이어그램을 그릴 수 있는 언어이다.
이와 비슷한 언어로는 MermaidJS, Graphviz, PlantUML 등이 있다.
D2 와 MermaidJS, Graphviz, PlantUML 의 차이에 대해선 다음 사이트를 통해 확인할 수 있다.
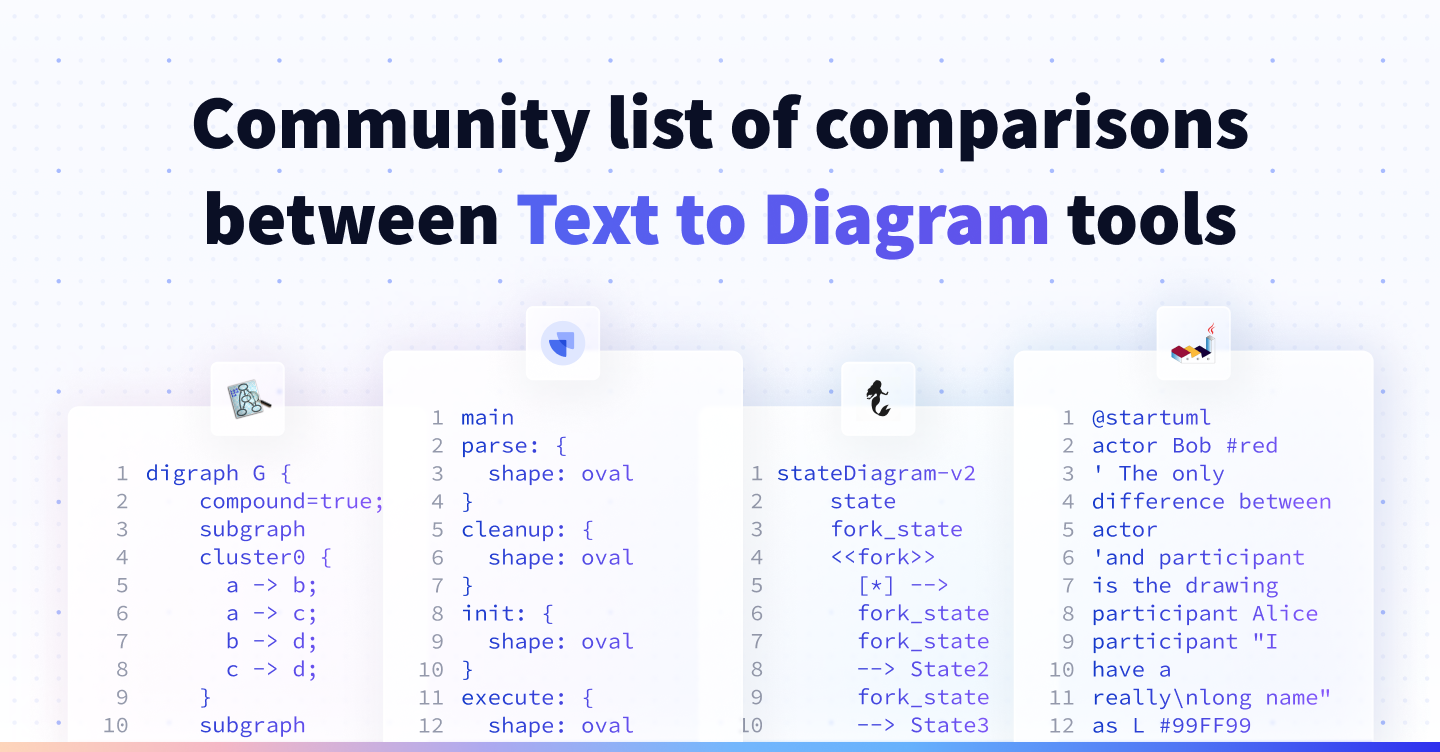
Text to diagram
Community list of comparisons between text to diagram tools
D2 의 단점이라면 시퀀스 다이어그램이 안된다는 점인데, 오픈소스이니 추가로 지원하지 않을까 소소하게 바라고 있다.
방법
방법은 처음 접하는 사람도 5분이면 파악이 가능할 정도이다.
# Actors
hans: Hans Niemann

defendants: {
  mc: Magnus Carlsen
  playmagnus: Play Magnus Group
  chesscom: Chess.com
  naka: Hikaru Nakamura

  mc -> playmagnus: Owns majority
  playmagnus <-> chesscom: Merger talks
  chesscom -> naka: Sponsoring
}

# Accusations
hans -> defendants: 'sueing for $100M'

# Offense
defendants.naka -> hans: Accused of cheating on his stream
defendants.mc -> hans: Lost then withdrew with accusations
defendants.chesscom -> hans: 72 page report of cheating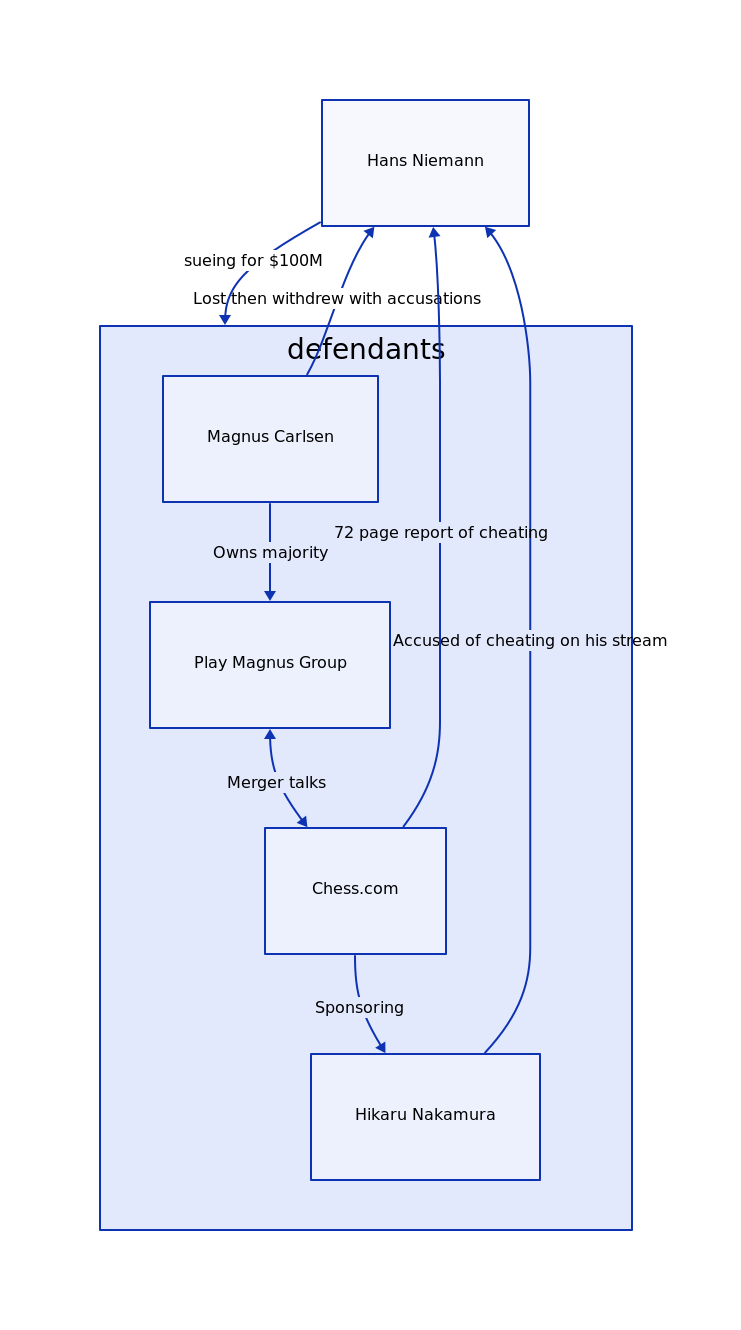
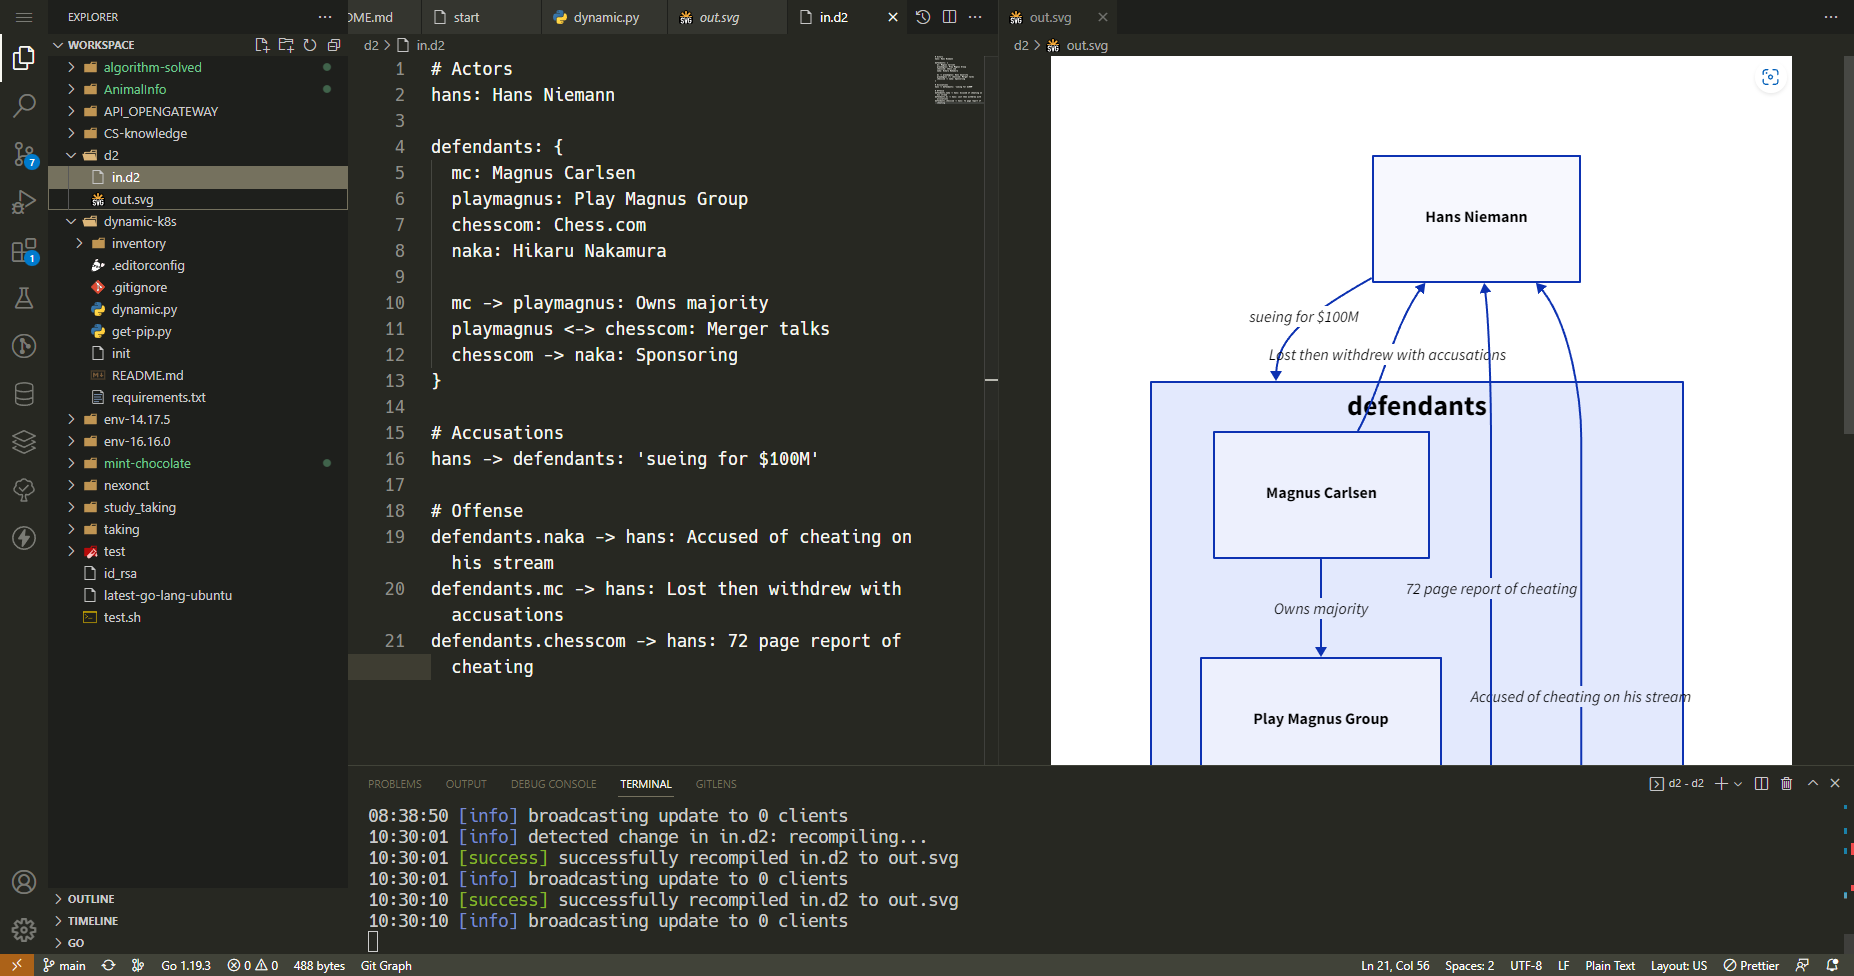
위와 같이 형식에 맞게 텍스트로 작업을 하면 svg 로 다이어그램이 출력이 된다.
VsCode 와 Vim 확장을 제공하며, CLI를 통해서 .d2 → svg 파일로 실시간으로 확인하면서 작업이 가능하다.
결론
다이어그램을 그릴 일이 필요하다면, 무조건적으로 추천한다.
수정도 쉽고 사용 방법도 쉬운데 안쓸 이유가 있는가? :)

댓글